Weather related performance impacts

To understand the weather-related impacts on our network performance, we’ve been collating and analysing data on Schedule 8 delay minutes and associated compensation costs since 2006/07. We have recorded the cost and minute values for weather-related incidents and attributing these under the following nine categories:

Graphic showing the nine categories of weather related incidents for rail.
We record the minutes of delay and the associated compensation costs paid to Train Operating Companies that accumulate due to the following nine categories of weather-related events: adhesion, cold, flooding, fog, heat, lightning strike, snow, subsidence and wind.

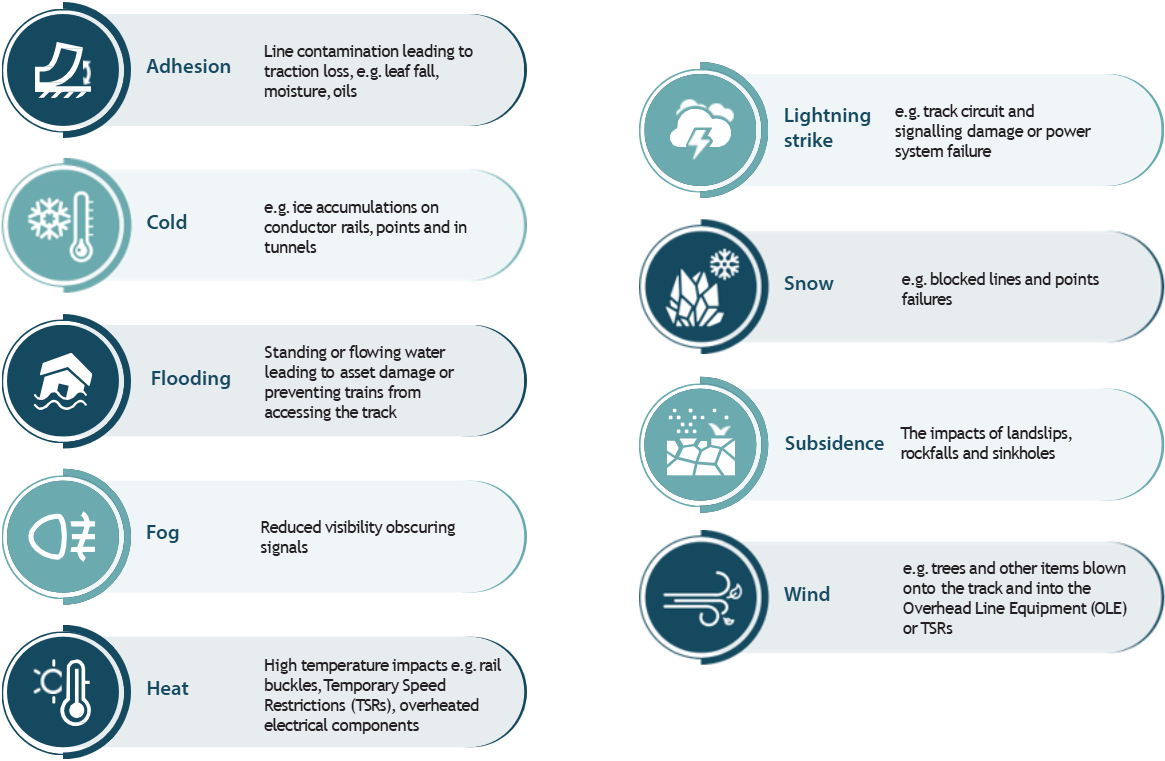
The main impacts of weather on the railway are: costs, poor performance (measured by the Public Performance Measure – PPM), and safety risks. Weather impacts vary significantly year-by-year, and this 20 year dataset provides interesting insight into the range and scale of experiences on the railway.

Graph showing delay minutes measured against financial years 2006 to 2025.
Delay minutes per year 2006-2025. This shows the number of weather-related delay minutes recorded for each financial year from 2006/2007 to 2024/2025. Each year’s data is a stacked column showing the delay minutes attributed to each of the nine weather related categories previously defined. The scale is in millions. The number of delay minutes for each category and each annual total varies every year. While the trend in total minutes is roughly stable at between two and 3 million minutes per year, we are seeing fewer cold and snow minutes and more flooding, heat and subsidence minutes.

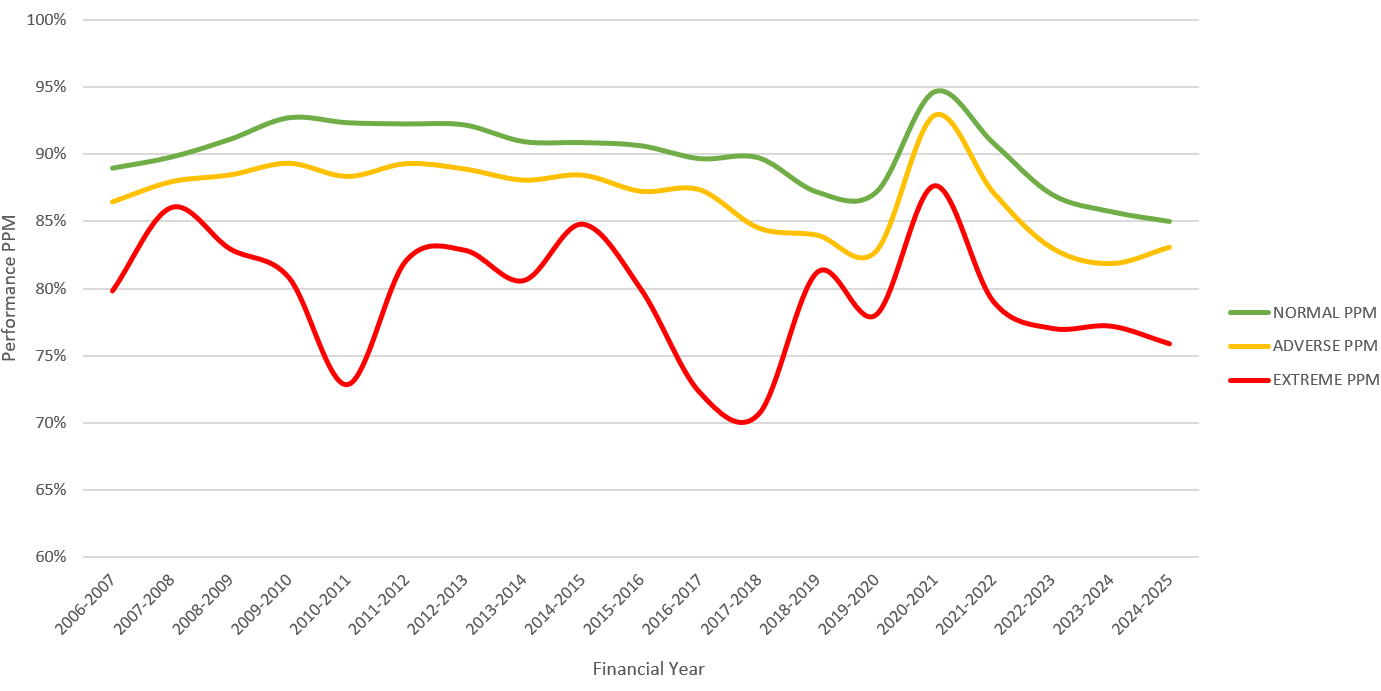
The average cost of all weather-related Schedule 8 payments across our network ranges from £80-100 million per year. If we include missed targets, repairs, and socio-economic costs, this raises this to an estimated £200-300 million per year. Our performance on adverse weather days, measured by the PPM has been 2-4% lower than on normal weather days.

Graph showing Public Performance Measure (PPM) measured against financial years 2006 to 2025.
Public Performance Measure (PPM) per year 2006-2025. This shows the compensation costs paid to Train Operating Companies for weather-related delay minutes recorded for each financial year from 2006/2007 to 2024/2025. Each year’s data is a stacked column showing the cost attributed to each of the nine weather related categories previously defined. The scale is in millions. While the costs for each category and each annual total vary every year they show an increasing trend and we are seeing fewer costs associated with cold and snow and more with flooding, heat and subsidence minutes.

Weather related delay and cancellation data

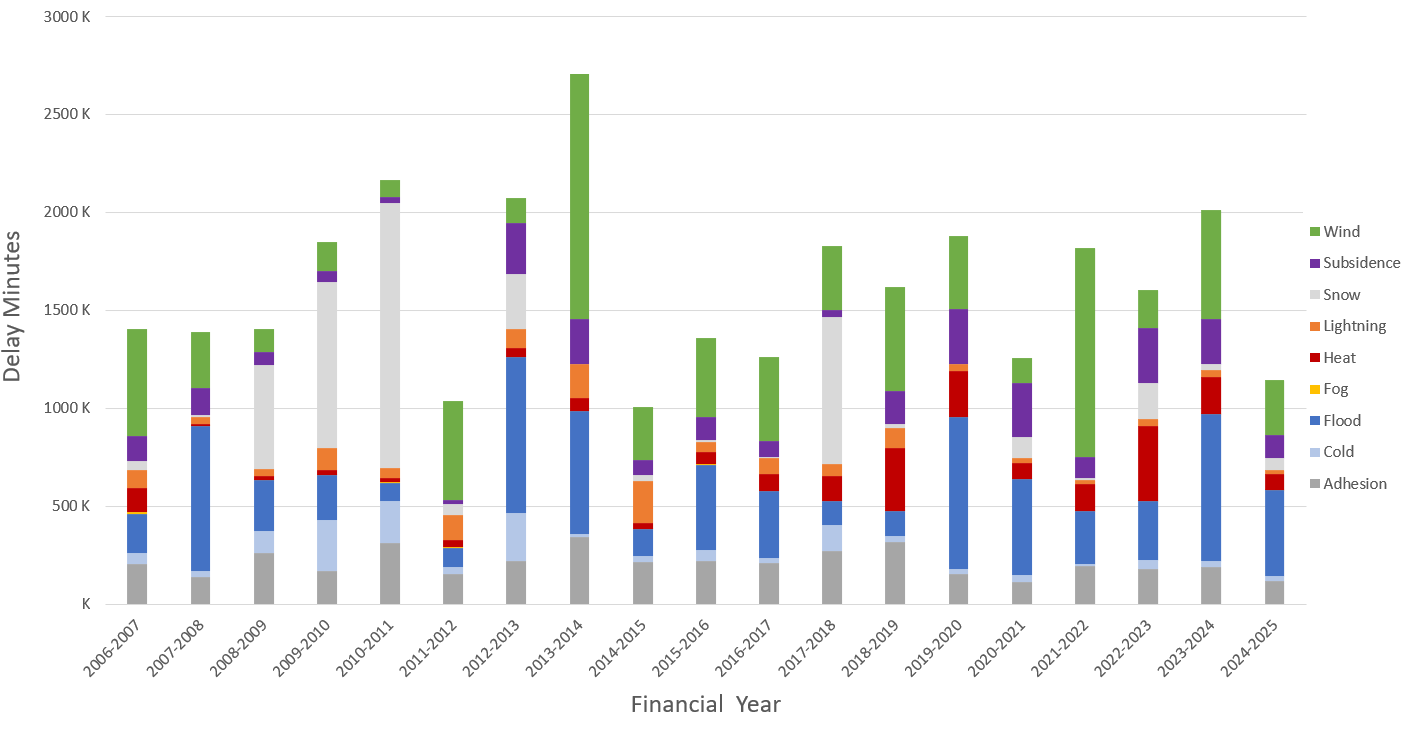
The charts above are based on detailed incident data. This data provides information about the location of individual weather impacts, the delay minutes associated with unplanned delays and cancellations (known as Schedule 8) and the cost of compensation to train operators for lost revenue. 

  • Weather related delays and performance charts April 2006 – March 2025
  • Schedule 8 delays and cancellations – detailed data April 2006 – March 2025
  • Weather related incidents and delays by country April 2006 – March 2025

Related pages

Understand climate change adaptation