Biodiversity Net Gain (BNG)
Biodiversity across Britain is under pressure from development, industry, agriculture and climate change. BNG is an approach that leaves the natural environment in a measurably better state than it was, before development took place, for example.
This link provides some basic guidance to help understand BNG.
Different countries have different approaches…
England – biodiversity net gain, using the biodiversity metric to determine impact of development, and then delivering a 10% uplift
Scotland – restore and regenerate biodiversity with statutory restoration targets to be introduced in 2026
Wales – net benefits for biodiversity to deliver an overall improvement in biodiversity with an emphasis on consideration of biodiversity early in the design process
… but all have the same intent, to help biodiversity, and Network Rail as an organisation that passes through all three countries has a part to play.
What do you need to do?
Simply put, carry on doing the work you do to make the infrastructure safe and enabling trains to run safely and on time. But when planning and doing that work, think: can you do it in a way that may also benefit biodiversity? Is there a Nature-based Solution (NbS) to the problem? Can you retain some of the habitat around your asset? Can you include some artificial habitat in the design to provide an opportunity for a particular species?
We’ve talked about the different approaches in each country of Britain. The golden thread throughout them is good, well-planned management. If this management takes biodiversity into account, we will support nature’s recovery.
Measuring our impact
We are regulated by the Office of Rail and Road and need to be able to report on our activities to demonstrate that we are using our funding properly. Explained below are formal calculations that we need to work out how much biodiversity we have. We also need to count things and record what we are doing. How many NbS have we used? How many bee hotels, bat boxes, and habitat piles have we placed around our work sites? And importantly, how many are being taken over by wildlife?
Talk to your route and regional ecologists and tell them what you have done. All this information helps us tell the story about all the work we do for nature.
Network Rail’s biodiversity target
The Government review into Network Rail’s vegetation management practices undertaking by John Varley in 2018 recommended that Network Rail needed an ambitious vision for its lineside estate, and that the estate needed to be managed as an asset. The Department for Transport (DfT) introduced targets for biodiversity, as part of their response to an action from the Varley review.
The targets were:
- no net loss of biodiversity on the network needed to be demonstrated from a 2020 baseline to 2024
- biodiversity net gain to be achieved across all regions by 2035
The State of Nature reports published each year from 2020 to 2024 show that the no net loss target has been achieved. These reports also describe activities taking place in each region to not only protect the existing biodiversity, but to also take action to enhance habitats as well.
The biodiversity metric is being used across the network to calculate the units of biodiversity that Network Rail is managing.
What are we calculating?
We are calculating a biodiversity value based on the characteristics of the habitats alongside the railway. Habitats are used as an alternative way to measure all the biodiversity that may be present at a location. Values have been automatically given to different habitats based on the types of animals and plants found in them. The habitat’s value increases if it is in good condition, for example, if it has all the species you’d expect and has a good structure. If the habitat is connected to other habitats nearby, its value will increase further. Improving the condition and connectivity of a habitat will improve its value.
Where do we get habitat and biodiversity data from?
Network Rail has a couple of techniques for collecting habitat data:
- Using ‘remote sensing’ e.g. satellites
- Through on-site surveys by ecologists
Satellites collect many different types of information. There are certain satellites that are specifically collecting environmental data and help to work out what sort of general habitat type is in a particular location. With an estate as big as ours, this method is useful when large areas of land need to be surveyed in a safe, regular, and consistent manner. On site data collection is performed by trained ecologists who use their knowledge of plant species and land management to work out what habitats are present. In both cases, the habitat data and other information is then used to calculate the biodiversity value.
How to calculate biodiversity units
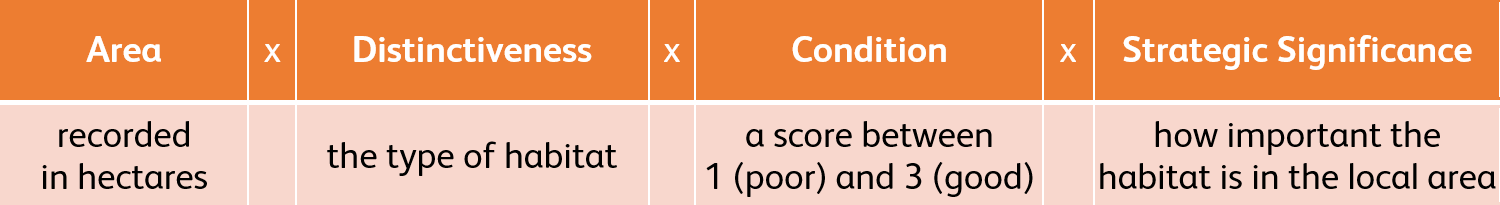
Using the biodiversity metric, which is a sum that uses the area of habitat, its type and condition along with a measure of local importance to determine the biodiversity value of that habitat.
The excel metric calculation tool can be found on the government website which provides detailed guidance for calculating BNG.
How to improve biodiversity units
In the calculation, we are not always going to be able to increase the area we are managing. Trials like the Kent Pilot have shown it is difficult to change the type of habitat within the confines of the railway fence, and we all know how difficult regular access can be to achieve. What we can do is improve the condition of habitats, and improve how significant they are in the local area.
Every habitat used in the metric has a number of features that you would expect to be found in it. A high scoring habitat in good condition will have most, if not all of these features. Poor condition habitats will not.
For example, a woodland habitat has about 13 features which include:
- The number of tree species present
- The amount of dead wood in the habitat (which is good for insects)
- Whether invasive species are present
- If trees are all the same age
- Whether the woodland too dense and prevents light getting to the ground for flowers to grow
… and so on. If that woodland needs managing because it has been assessed as a leaf fall risk, you will need to remove trees to ultimately reduce the numbers of leaves.
- You could clear fell the site – it would solve your immediate leaf problem, but the removal of vegetation will allow leaves from elsewhere to blow in and cause problems.
- Instead, you could remove certain trees to reduce the density, and reduce the height of others. This creates gaps in the canopy and treats the invasive species, reducing the number of leaves getting to the railway, retaining a barrier to prevent other leaves blowing in, increasing ground vegetation which will catch more leaves, and reduce the issues with invasive species. This also massively increases the biodiversity in the area.
- Increasing habitat condition from poor to good can give a 300% increase in biodiversity units.